
NepalBoardNepal Statistics & Open Data Dashboard
A national statistics dashboard covering economy, migration, population, agriculture, trade, energy, health, and tourism — data from 1960 to 2024.
Explore Data Sections
8 sections · 50+ charts
Economy & Development
GDP, inflation, FDI, poverty, and HDI across Nepal's 35-year economic journey with political context overlaid.

Migration
Labour outflow, remittances funding a quarter of GDP, and student migration breakdown.

Population
Census data, population pyramid, 125+ ethnic groups, and urban/rural split since 1960.
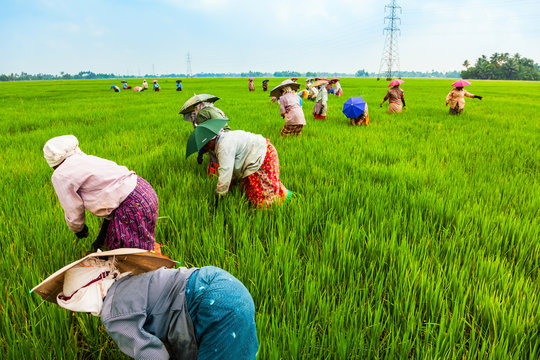
Agriculture
Terraced hills, monsoon cycles, and the crop data behind a workforce of 60%.
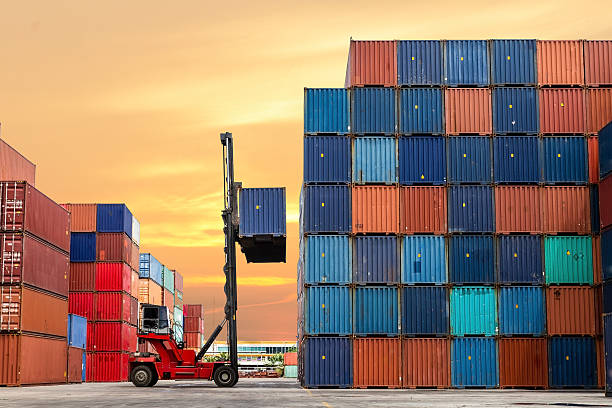
Export & Trade
Nepal's widening trade deficit and top exports — cardamom, tea, and carpets.
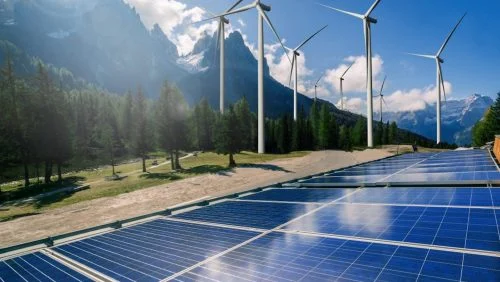
Energy
The rivers that could power a continent — hydropower potential, installed capacity, and the end of loadshedding.
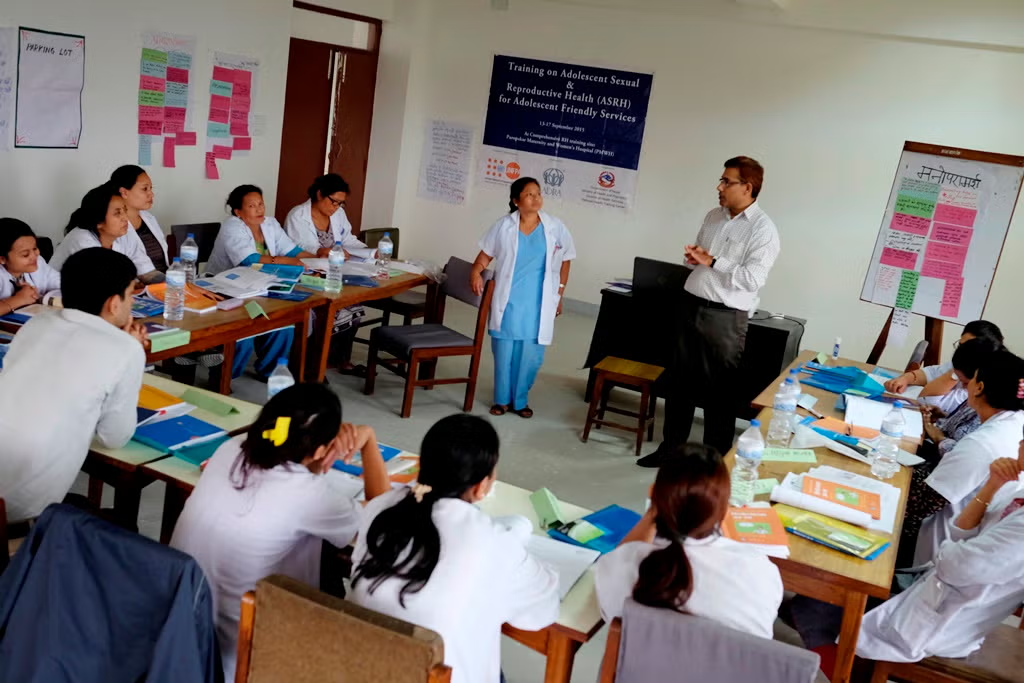
Education & Health
Literacy doubled, infant mortality quartered, life expectancy doubled since 1960.
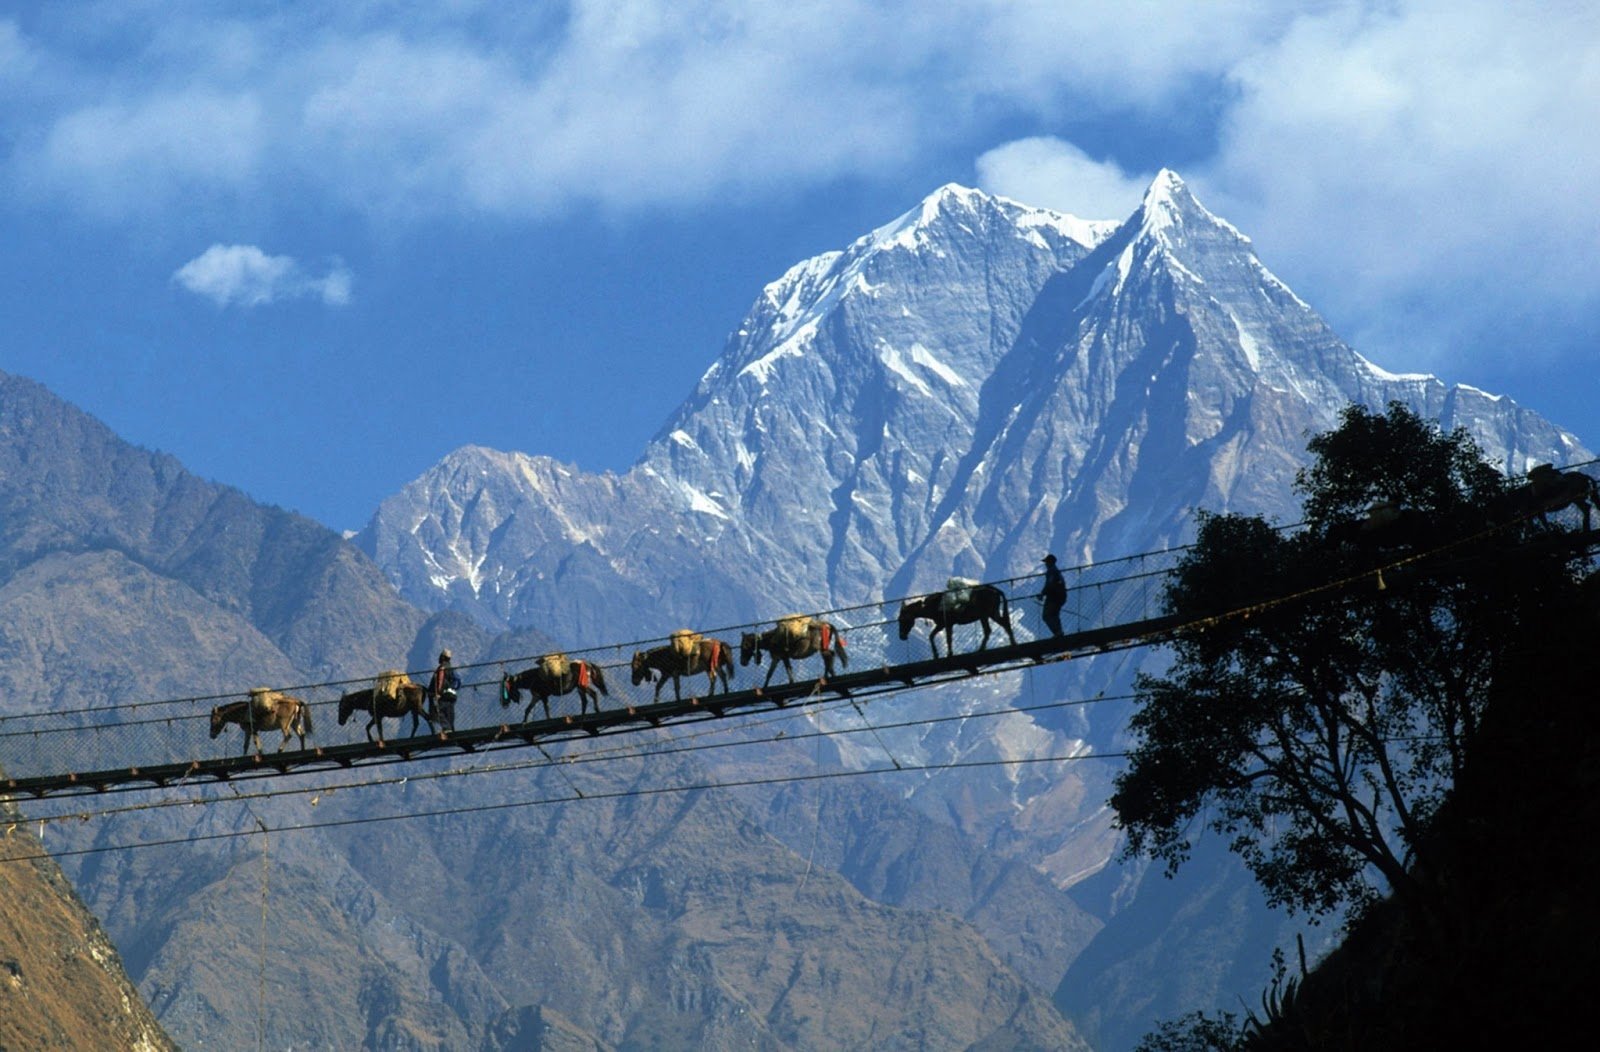
Tourism
Arrivals, revenue, trekking permits, 8 of the world's 14 highest peaks, and COVID's impact on Nepal's mountain economy.